

Your Plant Hardiness Zone – the USDA Map Has Changed!
go.ncsu.edu/readext?976130
en Español / em Português
El inglés es el idioma de control de esta página. En la medida en que haya algún conflicto entre la traducción al inglés y la traducción, el inglés prevalece.
Al hacer clic en el enlace de traducción se activa un servicio de traducción gratuito para convertir la página al español. Al igual que con cualquier traducción por Internet, la conversión no es sensible al contexto y puede que no traduzca el texto en su significado original. NC State Extension no garantiza la exactitud del texto traducido. Por favor, tenga en cuenta que algunas aplicaciones y/o servicios pueden no funcionar como se espera cuando se traducen.
Português
Inglês é o idioma de controle desta página. Na medida que haja algum conflito entre o texto original em Inglês e a tradução, o Inglês prevalece.
Ao clicar no link de tradução, um serviço gratuito de tradução será ativado para converter a página para o Português. Como em qualquer tradução pela internet, a conversão não é sensivel ao contexto e pode não ocorrer a tradução para o significado orginal. O serviço de Extensão da Carolina do Norte (NC State Extension) não garante a exatidão do texto traduzido. Por favor, observe que algumas funções ou serviços podem não funcionar como esperado após a tradução.
English
English is the controlling language of this page. To the extent there is any conflict between the English text and the translation, English controls.
Clicking on the translation link activates a free translation service to convert the page to Spanish. As with any Internet translation, the conversion is not context-sensitive and may not translate the text to its original meaning. NC State Extension does not guarantee the accuracy of the translated text. Please note that some applications and/or services may not function as expected when translated.
Collapse ▲We use the Hardiness Zone Map as one of the tools to help us choose the right plant for the right place, especially for cold hardiness. The USDA recently updated it. Hooray! This is big news because the last update was more than 10 years ago and things “they are a’changing’”. Unpredictable, may be a good way to think about the highly variable nature of the extreme minimum temperatures of recent years, plus we’ve got more info plugged into the equation than before. The new map is more precise and detailed, now using data collected from 13,412 weather stations across the country, with more than 5400 additional stations than the old map had access to.
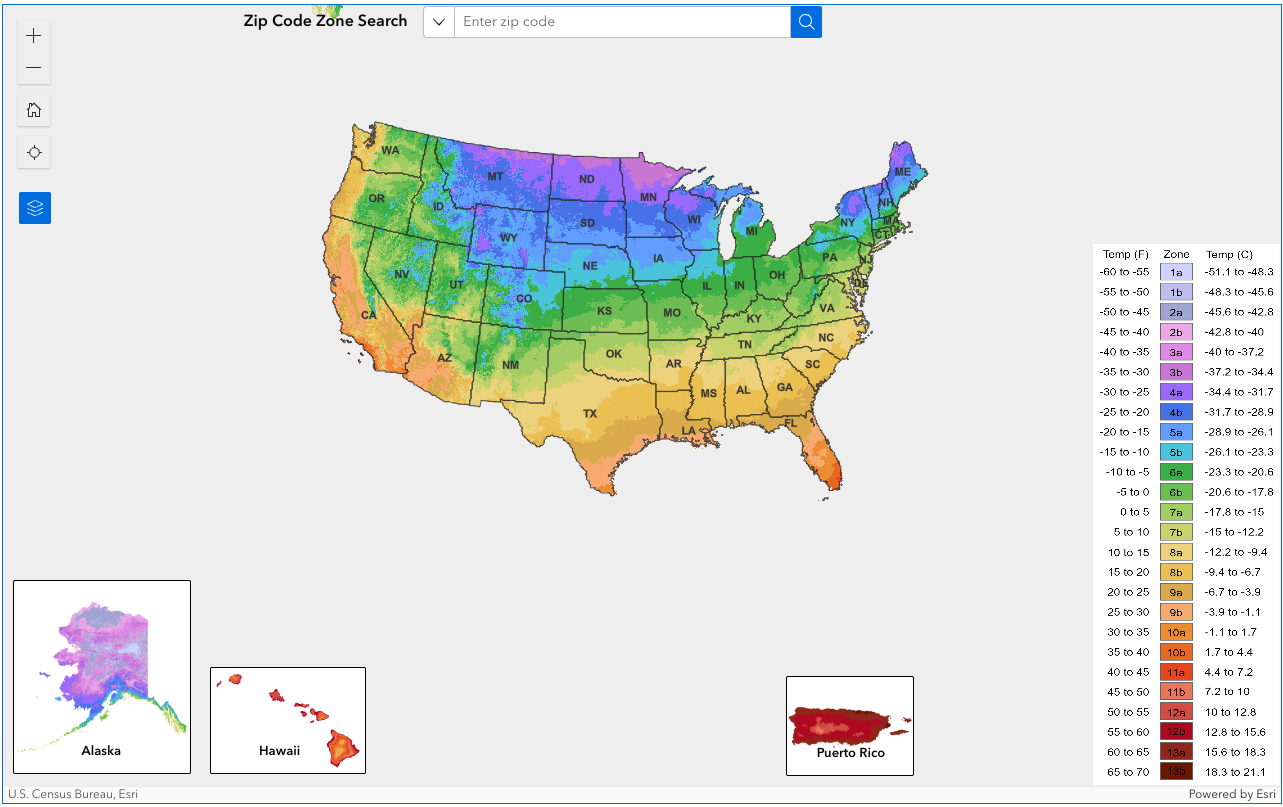
The map divides the continental United States, Alaska, Hawaii and Puerto Rico into 13 zones (and two half-zones within each zone) based on average lowest winter temperatures over 30 years, from 1991 to 2020.
Well, surprise, surprise – the 2023 version of the USDA Hardiness Map reveals that about half the country shifted up to the next warmer zone. This indicates that these areas warmed up somewhere between 0 to 5 degrees Fahrenheit over the past 11 years. Hardiness zones in this map are based on the average annual extreme minimum temperature during a 30-year period in the past, not the lowest temperature that has ever occurred in the past or might occur in the future, so keep the definition of “average annual” in your reckoning for using the map’s information.
The most increase in detail is really visible for Alaska, but what about where you live? The 2023 web version offers a Geographic Information System (GIS)-based interactive format and is designed to be user-friendly. To find out which zone you’re in, type in your zip code in the box on the top of the map. Just be aware that although this edition of the map is drawn in the most detailed scale (down to 1/2 mile square) to date, there could still be microclimates that are too small to show up on the map, like is your foundation dark brick and acting like a solar heat collector during the day, radiating heat at night? Or are you at the bottom of a slope and maybe in a “cold pocket” where cold air settles?
Keep in mind that plant hardiness is determined in the landscape and not in containers above ground, where they don’t have the benefit of the temperature modification of the ground, so if you’re into container gardening more protection will be needed when considering “hardiness”.
Hardiness zone information is a good place to start, however consider that wind, soil type, soil moisture, humidity, pollution, snow, and winter sunshine can greatly affect the survival of plants. The way plants are placed in the landscape, how they are planted, and their size and health might also influence their survival. Knowing the factors of your particular site and what they might mean to the growing environment is very important. Benefit from the logic of “Know Before You Grow”. Your wallet will appreciate it.
 Another helpful addition to this new map is the interactive component, which is a really interesting section at the bottom of the map that shares “Tips For Growers” with videos for Gardening Tips, Weeding, Soil Health and different tips for how to use the map details – or avoid them if you’re not into that much detail.
The seed catalogs are starting to arrive in the mailbox, and I’m getting excited to start planning for next year. Some fun planning tools to play around with: https://planthardiness.ars.usda.gov/ and then dive into the Extension Gardener Plant Tool Box at: https://plants.ces.ncsu.edu/ for a searchable database of detailed descriptions and photographs of 4,717 plants that grow in and around North Carolina. Use the “Find A Plant” button at the top to select the perfect plant for a specific location by clicking on the features of your site and your personal preferences.